Infographic ‘The militarization of Europe’
May 9 is Europe’s Day of Peace. On the occasion, and together with the European Network Against Arms Trade (ENAAT), we’ve prepared an infographic displaying military spending and other indicators of militarization.
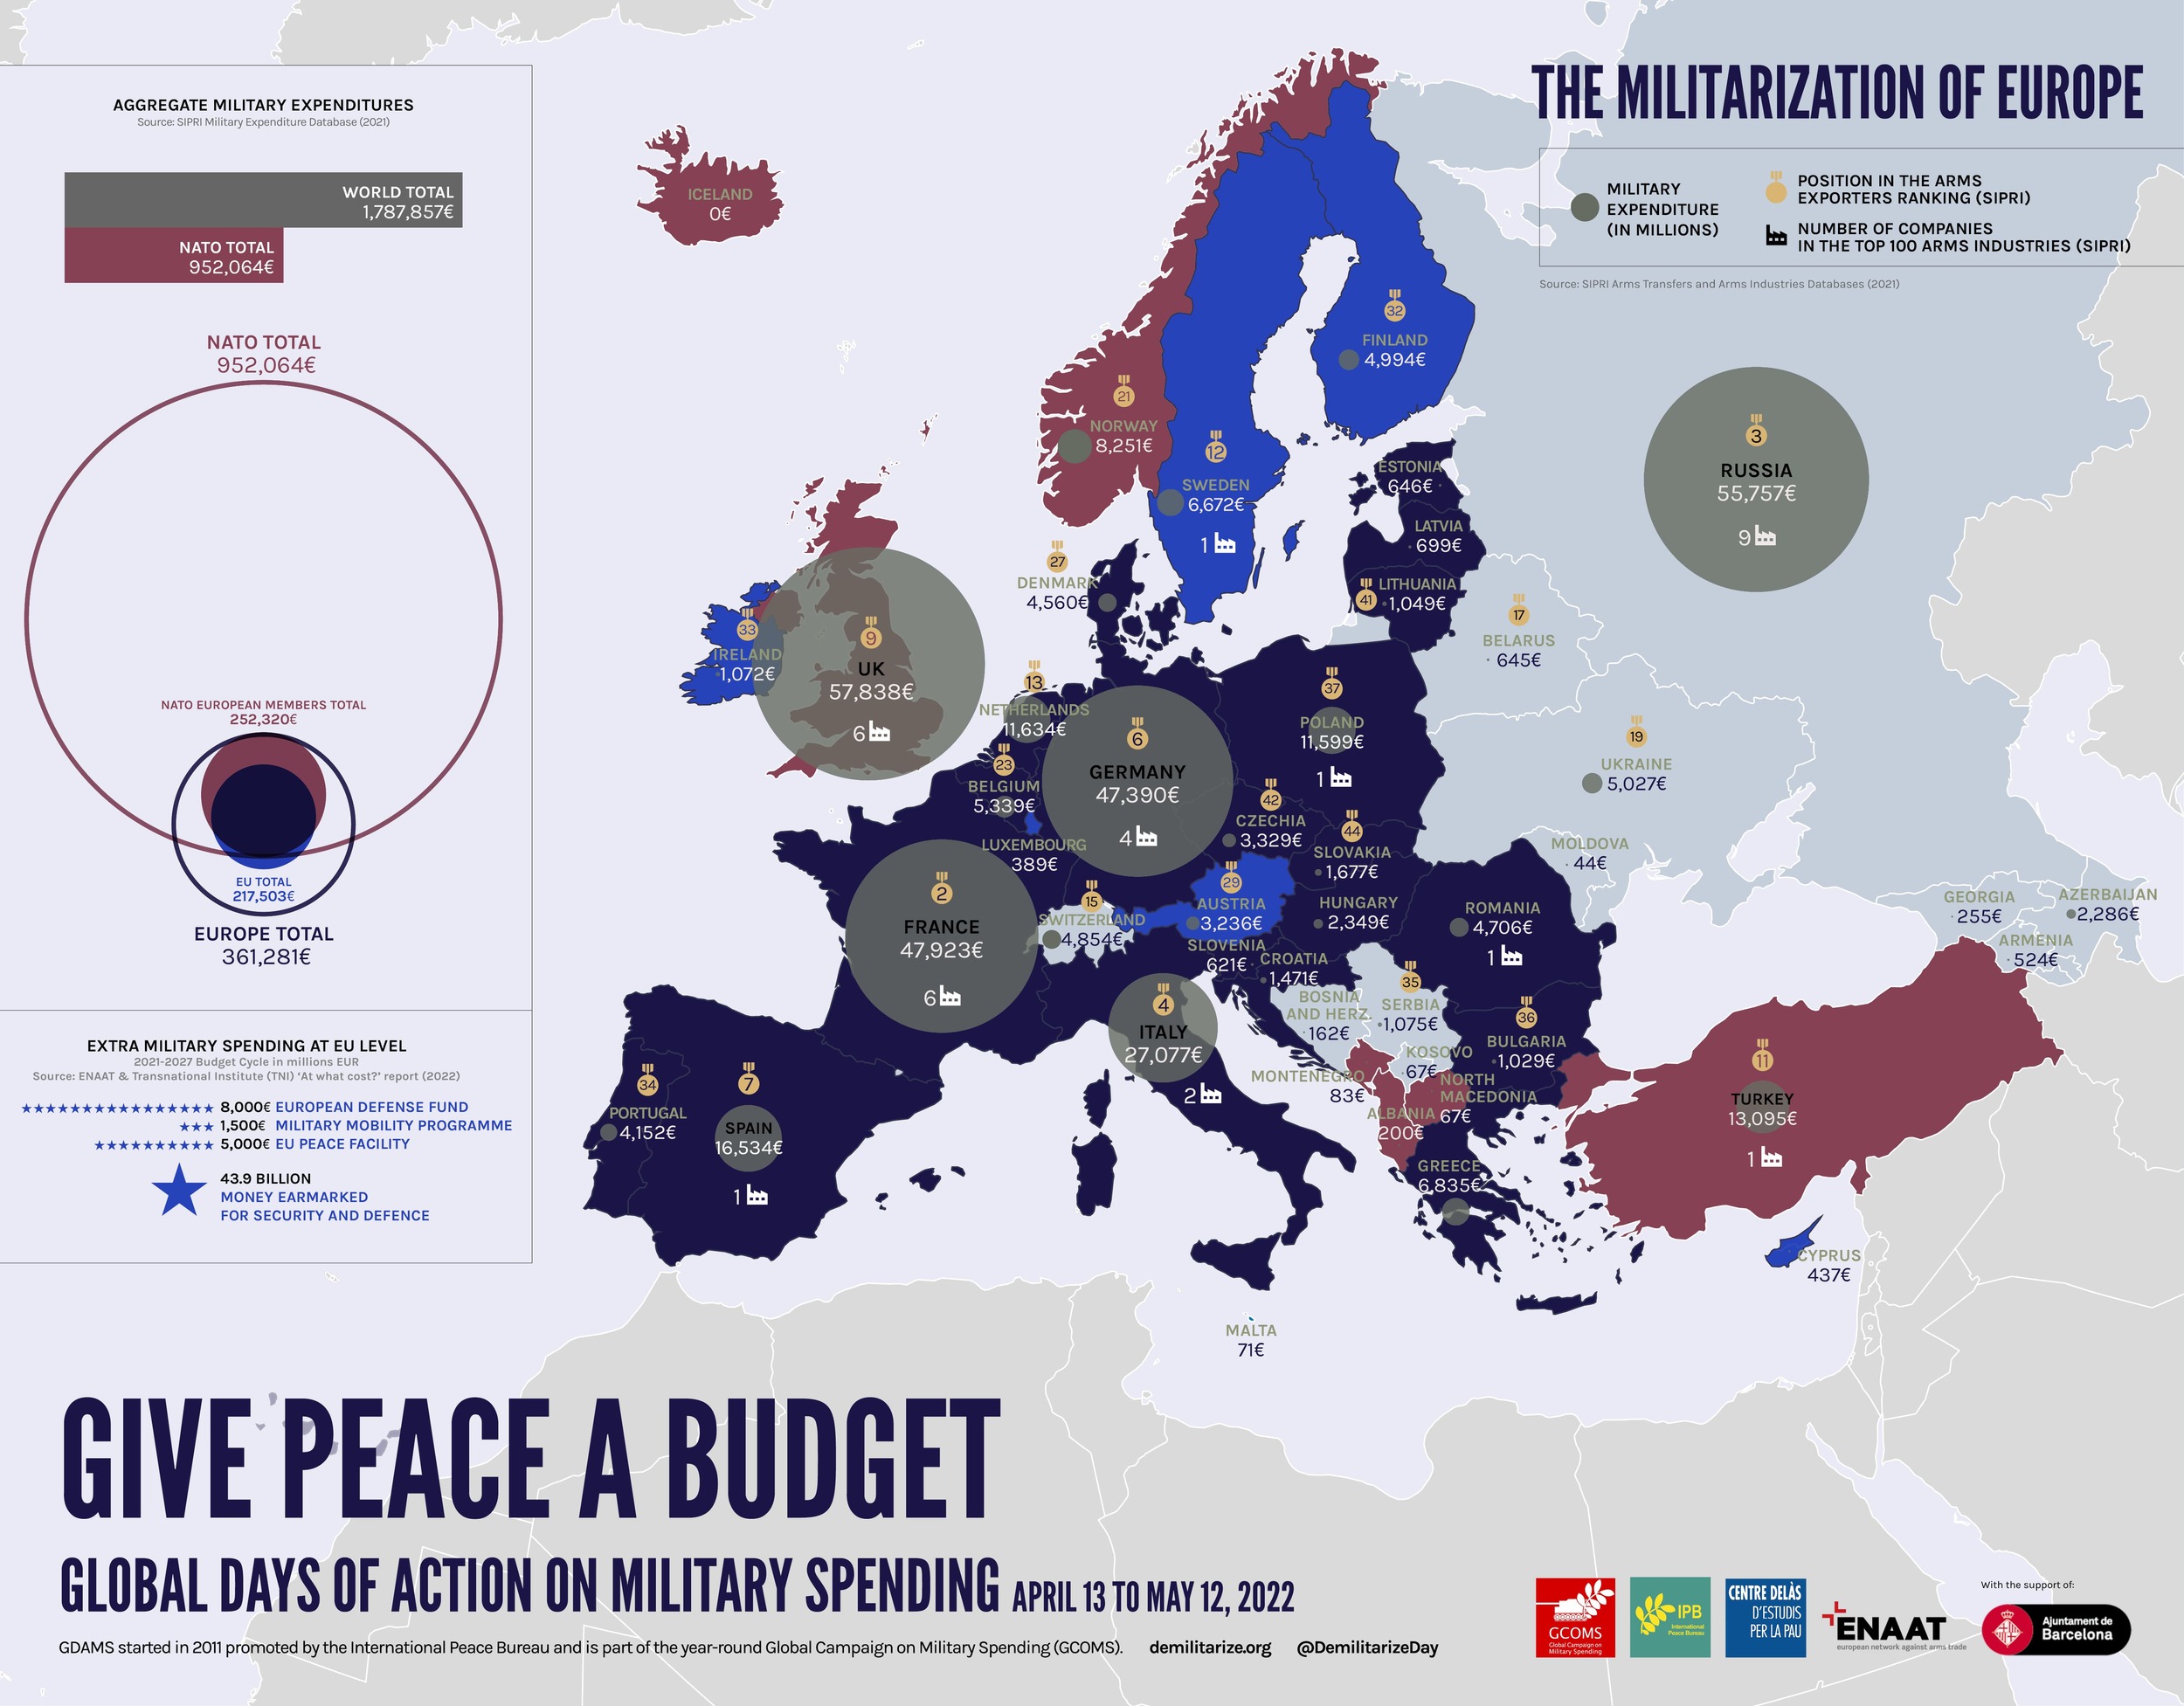
Countries In red are NATO member states, in light blue members of the EU, and in dark blue both countries in both NATO and the EU.
The Member States of the European Union have been increasing their military expenditures for several years now, culminating to €217 billion in 2021, and up to €275 billion if the UK is included. This makes the EU-27 Member States and UK collectively rank second on the global scene, after the US and before China, and spending almost 5 times more than Russia.
NATO countries spend 17 times more. Our point: how are further increases going to change the current situation and build security?Besides military expenditures, the infographic also shows countries’ position at the Arms Exporters Ranking and the number of companies at the Top 100 arms industries.
Sources:
– Stockholm International Peace Research Institute (SIPRI) Military Expenditure, Arms Transfers, and Arms Industries Databases (2021)
– European Network Against the Arms Trade (ENAAT)
– Transnational Institute (TNI), ‘At what cost?’ report (2022)