World Military Spending · 2021 biggest spenders
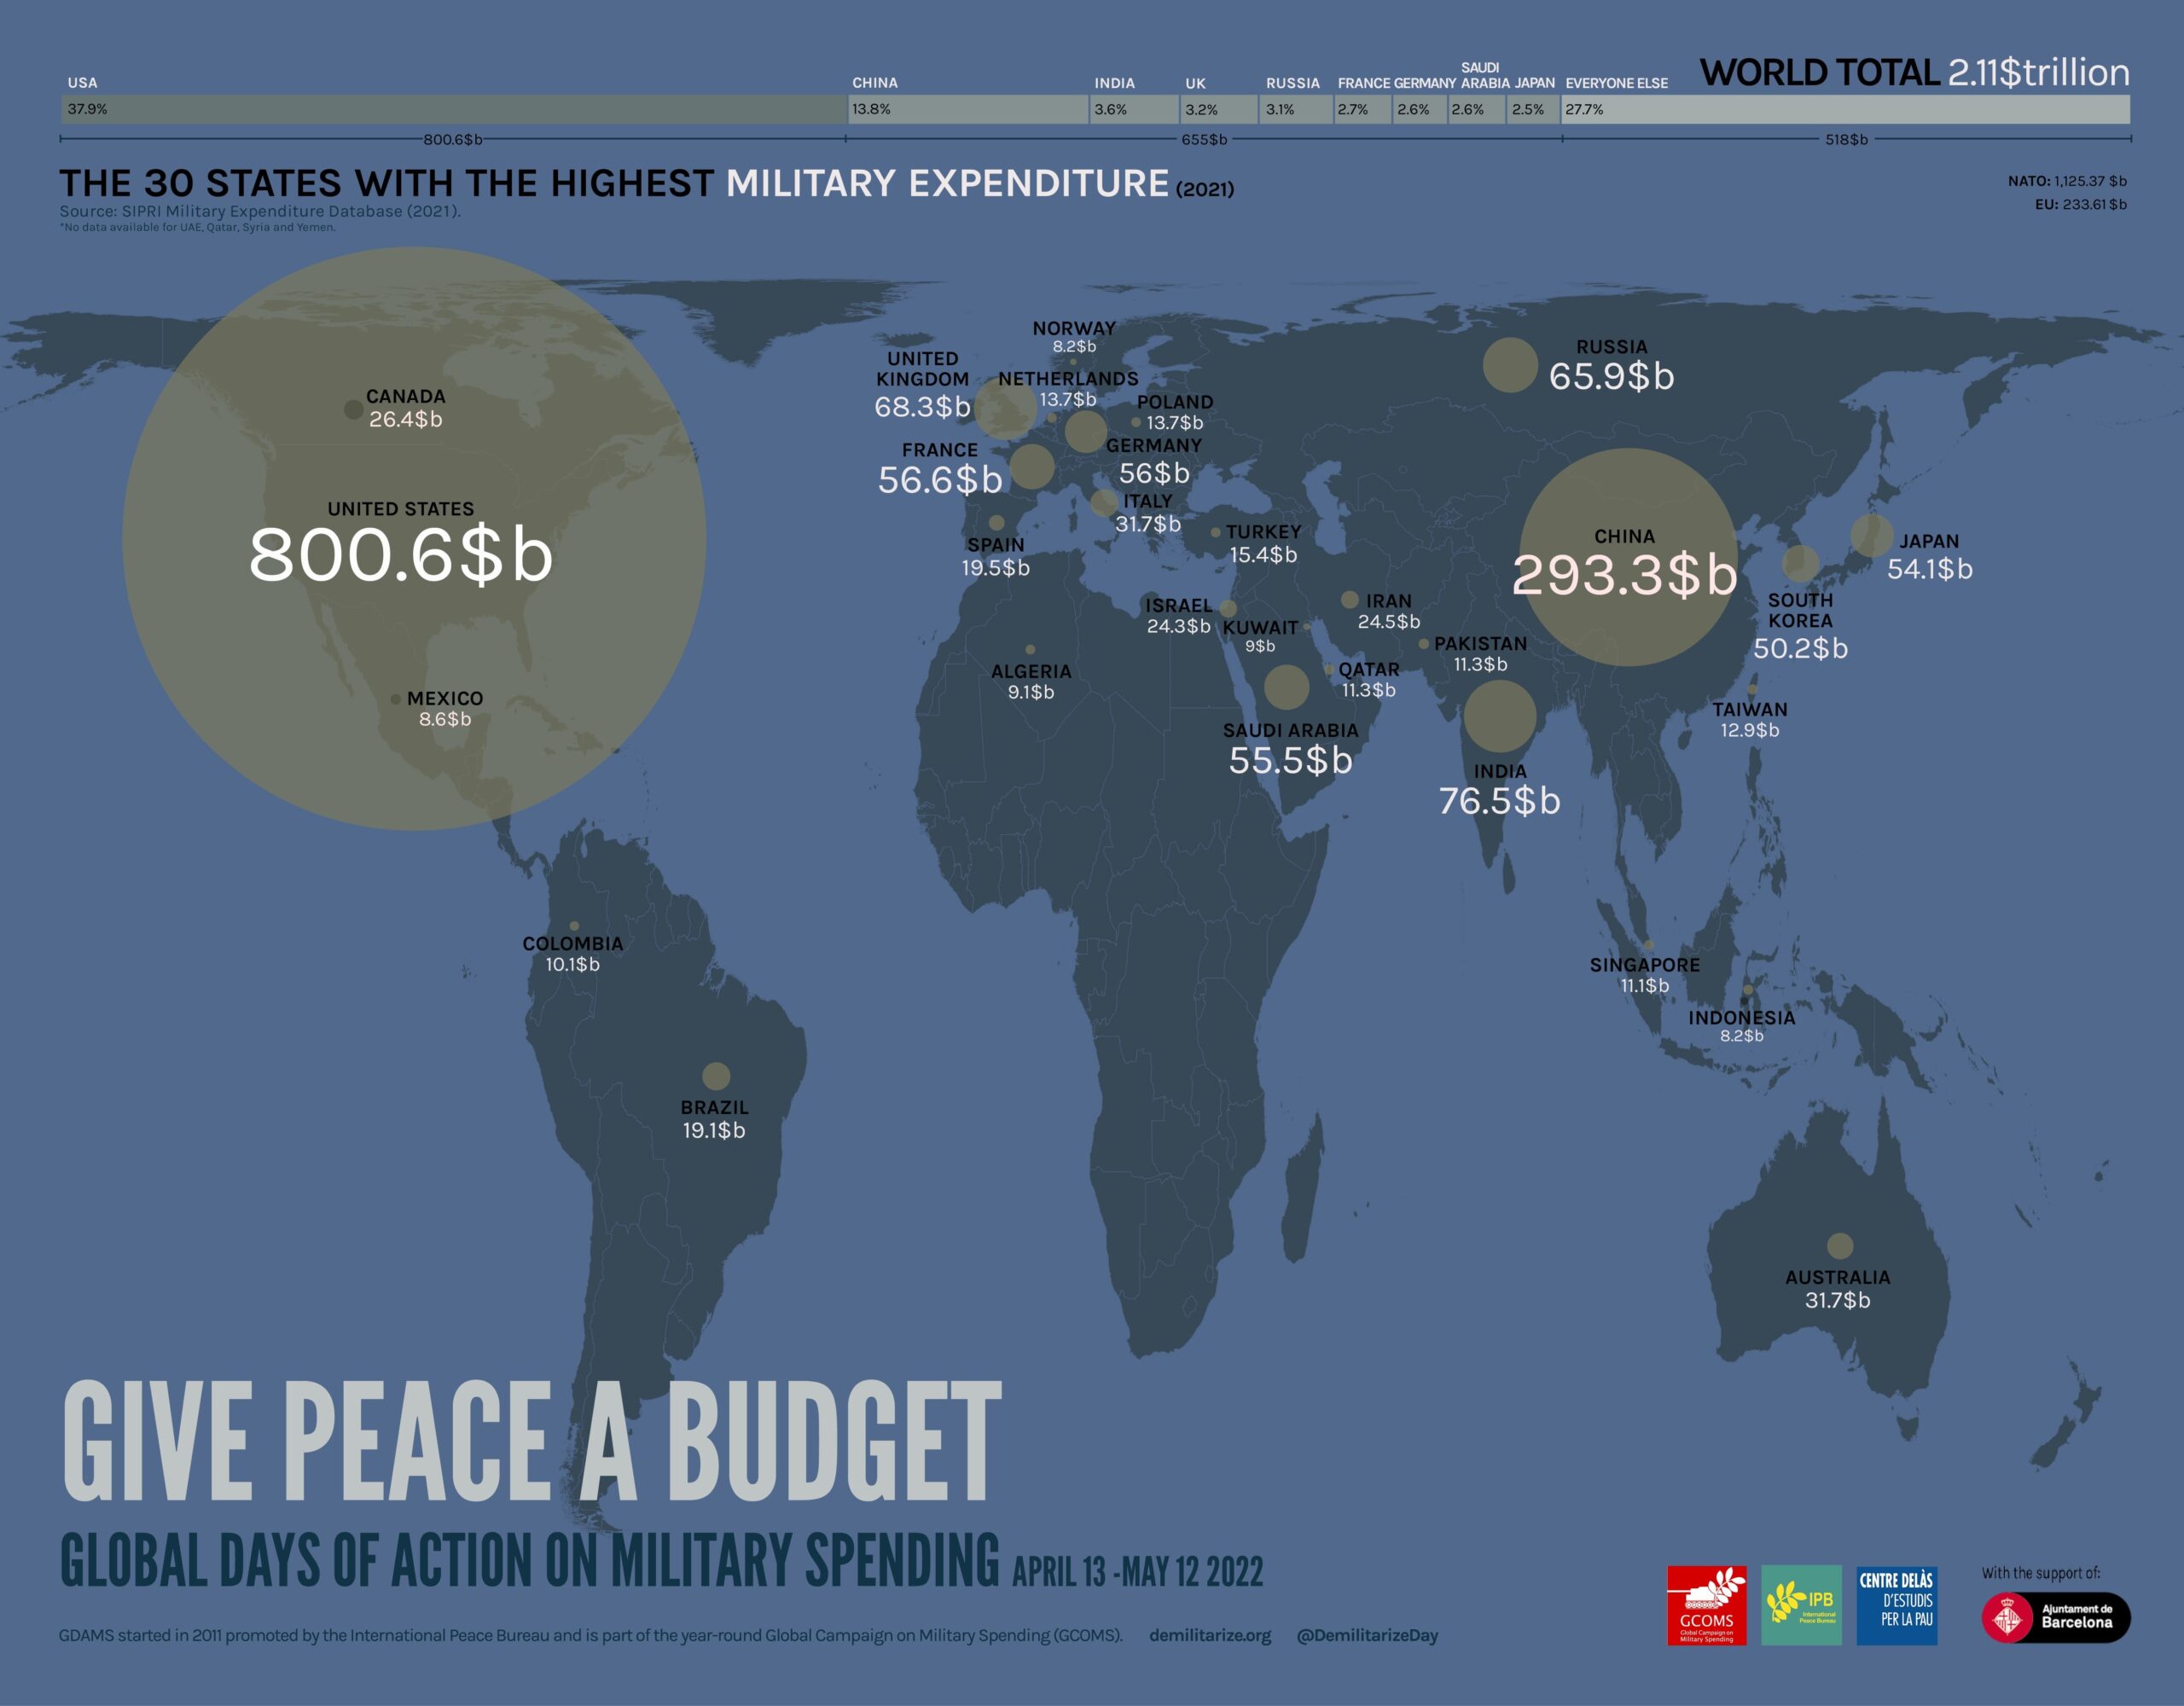
We’ve updated our world map infographic, showing through bubbles the 30 biggest military spenders in the world. It draws data from the SIPRI Military Expenditure Database, figures for the year 2021.
The Stockholm International Peace Research Institute (SIPRI) released new data on global military spending for 2021, which is up for the seventh consecutive year to $2.11 trillion: $132 billion more than the previous year. This 0.7% increase in real terms reflects increases in military budgets approved by many governments throughout the first year of the Covid-19 pandemic.
The United States continues to lead by far in global military spending. Although its defence budget decreased for the first time in four years (-1.4 per cent), it still accounts for 38 per cent of the global total. Next on the list is China, which accounts for 14 per cent of global military spending and increased its military spending by 4.7 per cent over the previous year, India (+0.9 per cent), the UK (+3 per cent), Russia (+2.9 per cent), France (+1.5 per cent), Germany (-1.4 per cent), Saudi Arabia (-17 per cent), Japan (+7.3 per cent) and South Korea (+4.7 per cent). The combined military spending of the top ten countries accounted for three quarters of global military spending.
If we add up the expenditure of EU member states, the aggregate is 233.617 billion, 11% of the total, the third highest expenditure in the world after the United States and China. This figure will be added to the already growing defence budgets of each member state. Cumulative military spending by NATO member states is again over $1 trillion and represents 55 per cent of the global total. Almost all NATO member countries increased their military budgets by 2021, 9 of which have allocated 2% or more of their GDP to military spending.
These data show how most governments decided to increase their military spending, despite being in the midst of a health emergency caused by Covid-19 which had already been raging for many months.
The map displays on its upper side a bar graphic with the world total (2.11 trillion USD), and the proportion of it that the USA represents (800$b – 37,9%), the 8 next biggest spenders (almost another third), and everyone else (the last third).
To see older versions of this map click here.
Please feel free to use and share this map!